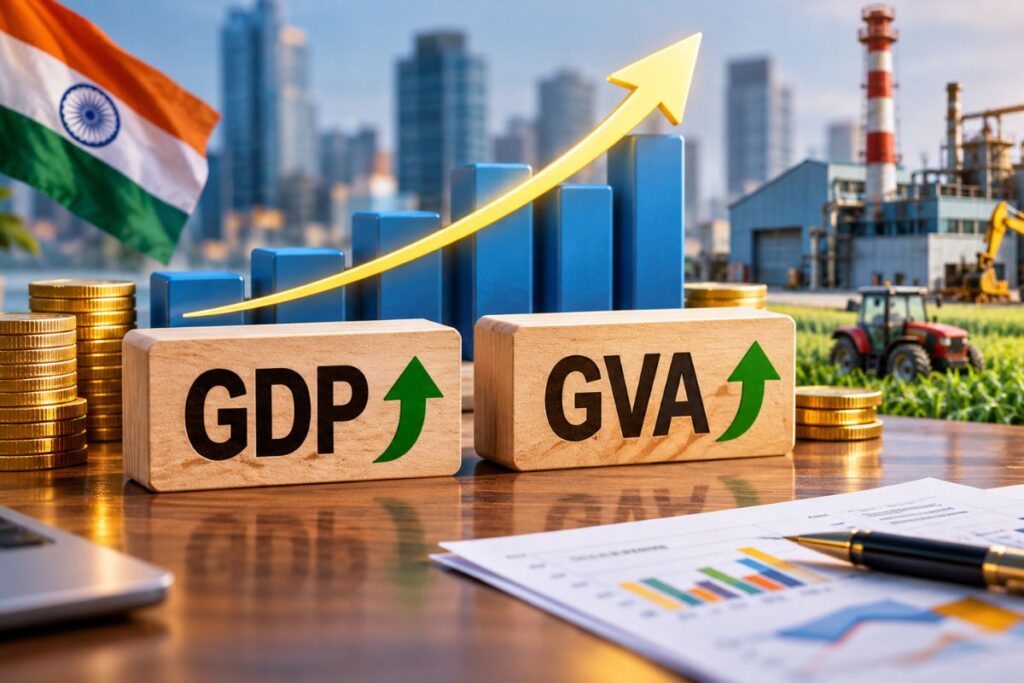
India’s recent growth forecast upgrade from 6.3% to 6.6% reflects expanding indirect tax collections and falling government subsidies, rather than an acceleration in real domestic production. Under national accounting conventions, gross value added, he measure tracking actual agricultural and factory output, remains flatter than headline gross domestic product suggests. This persistent India GDP vs GVA growth gap demonstrates that market-price revisions do not necessarily signal expanded shop-floor output.
Why Did the World Bank Raise India’s Growth Forecast to 6.6%?
The World Bank’s upward revision of 30 basis points to India’s financial year gross domestic product relies on a widening divergence within its underlying forecast tables rather than an industrial turnaround.
Gross domestic product (GDP) measures the total monetary value of final goods and services sold at retail market prices, whereas gross value added (GVA) measures the value of physical output after deducting intermediate input costs at basic factory-gate prices. In the World Bank India Development Update technical tables, baseline production parameters remained constrained: underlying GVA growth moved along a steady trajectory while top-line GDP was bumped up by 30 basis points to 6.6%.
Because the core production baseline shifted very little, the statistical bridge accounting for the upward shift consists almost entirely of net indirect taxes, he difference between indirect taxes collected and subsidies paid. The projection indicates higher transaction values and tax collections across markets rather than an influx of newly minted physical output from factories or farms.
How Do Taxes and Subsidies Artificially Widen the GDP-GVA Spread?
National accounting conventions mechanically boost headline GDP above basic production whenever product taxes outpace government subsidy payouts.
National statistical standards, structured around the System of National Accounts (SNA 2008) and documented by the Ministry of Statistics and Programme Implementation, National Statistics Office, define the relationship using a standard formula:
GDP=GVA+TaxesonProducts-SubsidiesonProducts
When a steel mill sells an alloy bar to an automaker, GVA captures the newly created value at the factory gate. Once the government applies the Goods and Services Tax (GST), , an indirect consumption tax levied on the supply of goods and services, , and pays out any relevant production or input subsidies, the net tax gets added to produce the final GDP market price.
If a government reduces outlays on food, fuel, or fertilizer subsidies while tax revenues expand, the net tax line widens. Consequently, GDP can rise while physical production remains entirely unchanged.
According to national accounting conventions, when net indirect taxes grow at a rapid clip while subsidy payouts moderate, GDP at market prices accelerates away from GVA. It does not imply faulty bookkeeping; it reflects international accounting design. But equating that arithmetic lift with surging physical production misreads the underlying source.
Which Budget Figures Drove the Net Indirect Tax Wedge?
The net indirect tax expansion was powered by double-digit GST growth coinciding with steep reductions in central food and fertilizer subsidies.
Official monthly statements from the Controller General of Accounts (CGA) confirm the dual fiscal forces widening this wedge in practice.
Union government gross GST receipts have consistently expanded at double-digit rates, driven by formalization and steady compliance tracking. Meanwhile, government subsidy tracking detailed in the India Union Budget Expenditure Profile Statement on Subsidies reveals major recalibrations across major heads: food subsidies were budgeted down to ₹2,27,629 crore, while nutrient and urea fertilizer subsidies were trimmed from previous peak allocations.
With gross tax collections sustaining momentum and central subsidy commitments moderating from earlier highs, the net indirect taxes impact on GDP contributed a disproportionately large share to the calculated growth rate. The arithmetic lift appeared on ledger balances, raising the market valuation of the existing flow of goods without demanding higher factory output.
What Does Sector-Level GVA Reveal About Physical Production?
Core physical production sectors remain subdued, showing that the headline GDP bump has not reached farm yields or mass manufacturing lines.
Direct output metrics from the MoSPI National Accounts Releases illustrate where physical momentum has diverged from headline forecasts.
According to MoSPI official sector estimates, Agriculture, Livestock, Forestry & Fishing grew at a subdued 3.5%, dampened by uneven seasonal rainfall and moderated rural farm revenues. In manufacturing, production indices show an uneven recovery: while capital goods and infrastructure construction expanded, everyday consumer items lagged.
Physical output tracking from the MoSPI Index of Industrial Production (IIP) Visualizations confirms that volume output in consumer non-durables, , such as packaged staples and everyday household essentials, , has remained sluggish. Output volume has not matched the pace of nominal transaction values.
How Could Relying on Headline GDP Distort Economic Policy?
Overestimating underlying momentum based on tax-skewed GDP figures risks keeping borrowing costs elevated for businesses whose sales volumes have stagnated.
Government officials highlight that strong tax collections provide essential resources for productive state investments. The Ministry of Finance maintains that sustained GST buoyancy demonstrates real economic health, reflecting formalization, transaction velocity, and the steady integration of supply chains. International agencies like the World Bank point out that GDP at market prices remains the accepted international standard for cross-country performance comparisons.
At the same time, monetary authorities monitor the gap closely. Relying strictly on strong top-line GDP numbers risks mischaracterizing domestic demand conditions. If central bankers interpret an indirect-tax-boosted 6.6% GDP figure as evidence of an overheating domestic economy, they may delay expected interest rate cuts, , keeping credit lines and capital costs elevated for small firms whose output volumes have not shared in the headline gain.
Related reporting: Read our analysis on why Indian automotive suppliers are diversifying into aerospace and rail and what aviation assets are actually leased through GIFT City.
Frequently Asked Questions
Why is India’s GDP growing faster than its GVA?
India’s GDP is outpacing its GVA because headline GDP includes net product taxes (indirect taxes collected minus government subsidies paid). With Goods and Services Tax receipts growing rapidly while the central government reduced major food and fertilizer subsidies, the net tax wedge expanded, mechanically lifting GDP without an equivalent surge in underlying factory or farm output.
Did the World Bank’s growth revision mean Indian manufacturing output increased?
No. The World Bank’s 30-basis-point upgrade from 6.3% to 6.6% was largely concentrated in the net indirect taxes component of market-price GDP calculations. Underlying physical indicators from the Ministry of Statistics and Programme Implementation show that mass consumer non-durable manufacturing and agricultural output remained sluggish over the same period.
How does the GDP-GVA gap affect Reserve Bank of India interest rate decisions?
If the Reserve Bank of India’s Monetary Policy Committee relies primarily on an elevated headline GDP figure of 6.6%, it may view domestic consumer demand as robust and delay interest rate cuts. This risks keeping borrowing costs high for micro, small, and medium enterprises whose physical sales volumes have not matched the nominal GDP print

Praseetha K
Praseetha K is the Managing Editor of Clarity Times. She edits, verifies and publishes the newsroom's articles, and also writes analysis on policy, law, business and technology. Articles she writes are edited by the Editor-in-Chief before publication.